Los Angeles Monthly Market Overview
The Sundae Monthly Market Overview provides local insight into known flipper purchases.
October 2021
Real estate sales across the country follow seasonal patterns. The summer months are known for lower overall activity. After a busy spring, families begin to settle into their homes and vacation before school starts. This lull is traditionally followed by a busy fall. Investors flock to the market to buy properties that they can renovate during the winter in preparation, then sell the following spring.
The onset of October means that the summer market is officially over. In addition to seasonal patterns, more homes are entering the fold. This slow, but steady increase in inventory is promising to many potential buyers. Data from the early fall reveals that investors in Los Angeles are purchasing the added supply. Based on our findings, it’s clear that investors remain confident in the state of the market moving forward.
Flipper Purchases by Month
When interpreting this chart, it’s important to look for trends over time. These are purchases by known rehab investors who have resold within 12 months at a profit. Recent months suggest that investors are bullish on this red-hot market. As inventory increased, investors continued to buy. This confirms that they are betting on a strong market with no signs of slowing down.
Percentage of Flipper Purchases of Total Home Sales
This information can be used to determine investor sentiment as well as seasonal trends. As a general rule of thumb: when rehab purchases decrease, it shows market fatigue. As rehab purchases increase, it reveals excitement. Keep in mind that each market is different based on weather. California markets see slower summer months, while the fall and winter months are primed for investor purchases. In either case, flipper purchases serve as an indicator of price expectations.
At present, there is speculation that interest rates will go up. To combat this, people who want to sell are selling now rather than waiting. At the same time it’s going to be more expensive for buyers. This means that competition over properties will remain. Given the demand for housing, investors are wise to continue building their portfolios.
View Properties Near You
Flipper Purchases by Price Range
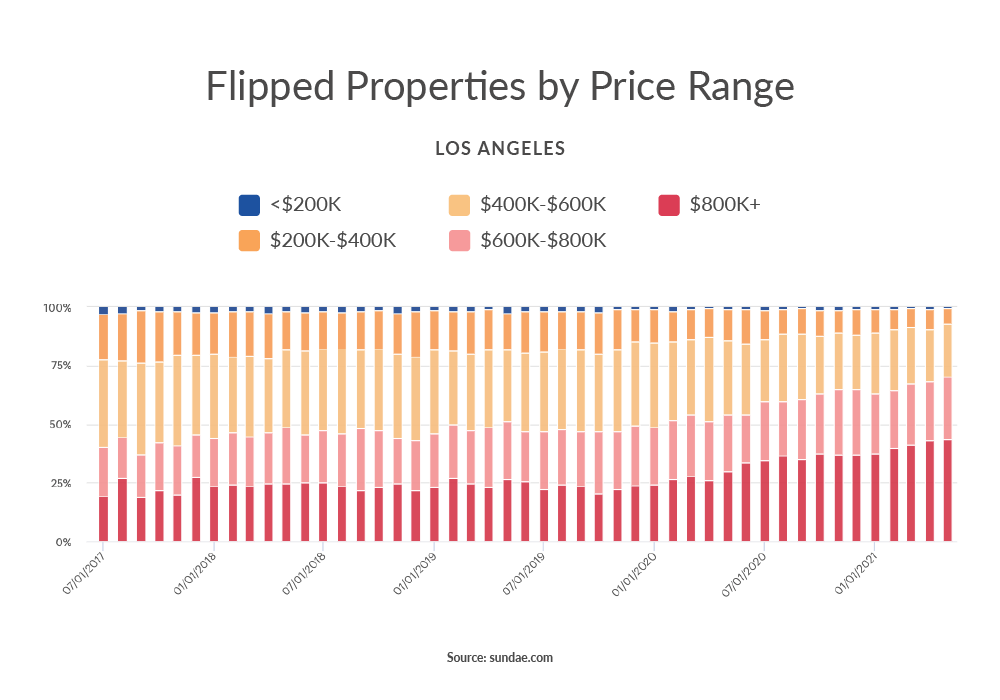
Looking at purchases by price segment gives us insight about market price movements and owner occupant preferences. Prices continue to climb, making houses at certain price points harder and harder to come by.
There are fewer homes available below $400,000 which is a reflection of the market. Homes are experiencing rapid appreciation and should continue to do so for the foreseeable future. Despite higher prices, buyers still benefit from the current state of the market. People are still flocking to buy homes because they can capitalize on lower monthly payments due to lower interest rates (for now). It’s time for investors to get comfortable purchasing properties in higher price ranges.
Flipped Properties by Property Type
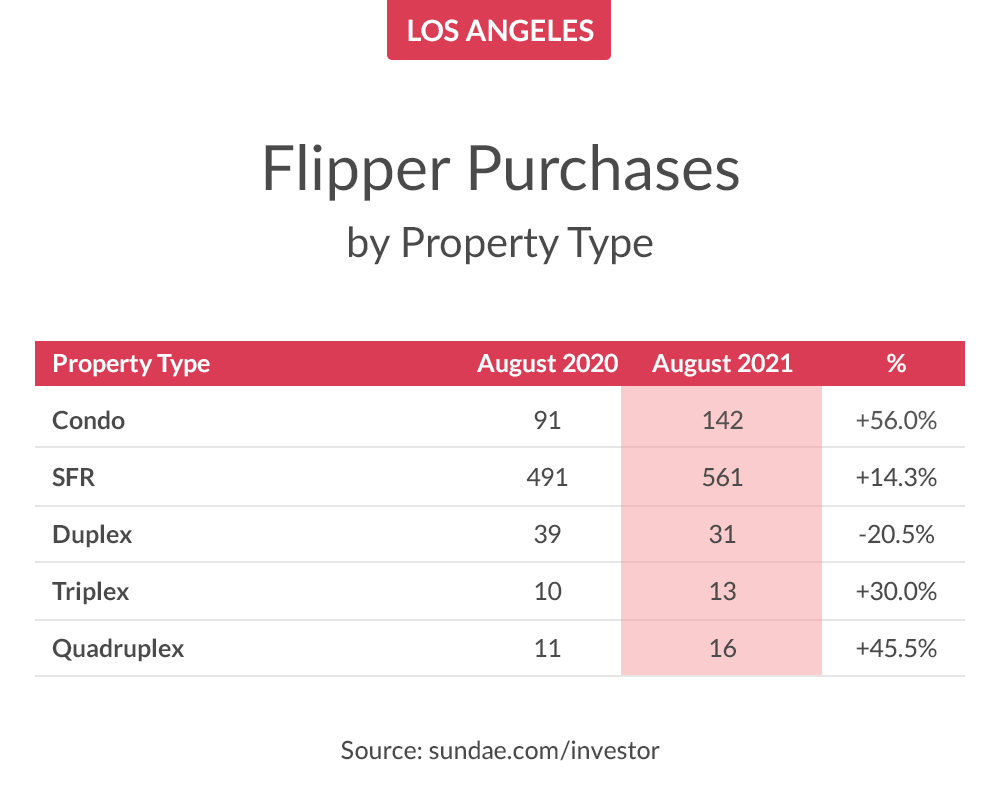
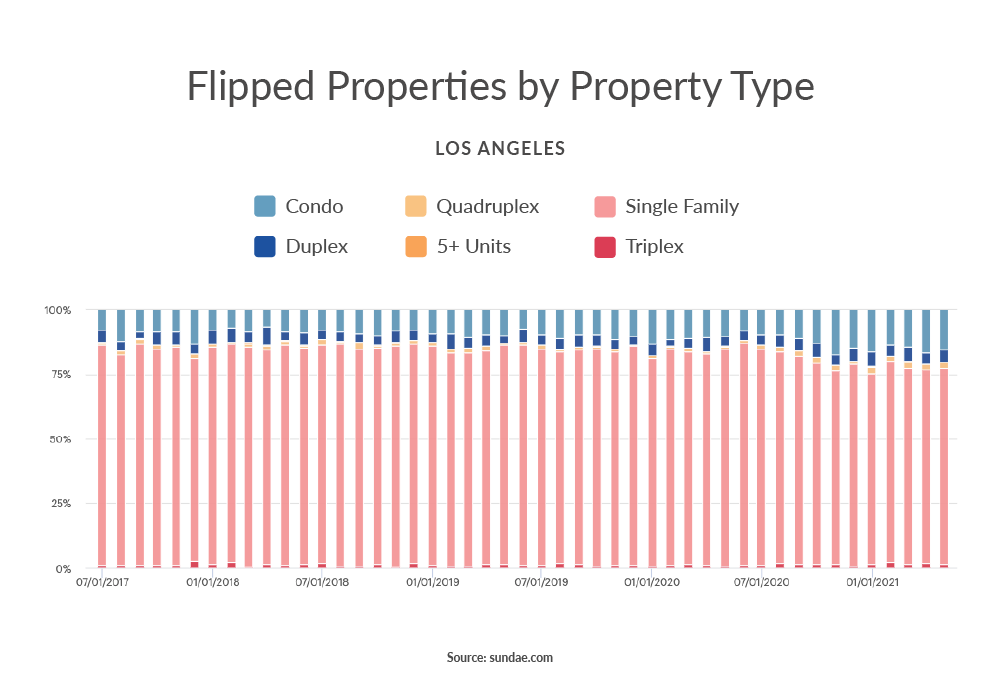
Each property type has advantages and disadvantages. Factors such as zoning and local legislation can have a huge impact on home renovations. In an effort to create affordable housing opportunities, California passed SB-9. This allows property owners to split a single-family lot into two lots and place up to two units on each. It creates the potential for up to four housing units on certain properties that are currently limited to single-family houses.
The other determining factor is availability. Single family homes are still coveted, but condos are back in style. With many people returning to the office, condos provide opportunities for city living and the convenience that comes with it.
As many as 3.5% of U.S. mortgages were enrolled in the forbearance program that ended in September. These homes are going to be sold pre-foreclosure during the fall and beyond. Given the demand for housing, there are going to be bidding wars for them.
Number of Properties Purchased vs. Sold by Known Flippers
Comparing purchases to sales helps us understand the strategies used by investors. During the early phases of the pandemic, flippers were rehabbing and selling homes as fast as possible to meet the demand for housing. In recent months, there has been a shift.
When there is little uncertainty, investors are more likely to buy and hold. This trend reveals a belief in economic stability moving forward, where flippers can display patience. Purchase and sale numbers have also been impacted by supply chain disruptions. As a result, flips are taking longer.
Share of Flipper Purchases Financed with a Loan
Most flippers rely on banks and hard money lenders to fund their projects. These graphs compare cash purchases and loans.
Cash offers have a higher likelihood of getting accepted because cash buyers do not need to go through underwriting with banks. Since 2020, cash purchases have increased due to greater competition. With fear of rampant inflation mounting, iBuyers and institutional investors are buying residential properties outright in large quantities. This is because real estate serves as a real asset. Since it is tangible, man-made, and scarce, it takes time to produce more. As a result, it goes up in value with the price level.
Expect the Market to Stay Hot
The market is showing no signs of slowing down this fall. Even as inventory continues to grow, demand for properties has remained constant among buyers. This positive outlook will keep prices high and make cash offers the new norm.
The Sundae Monthly Market Overview provides local insight into known flipper purchases.
June 2021
Most markets go through periods of high and low activity, from the intense spring to the quieter winter and summer months. Real estate is no different. Real estate investors become more active in late fall, especially those planning to put a house on the market in the spring. They need to add and list properties by the time home buyers — especially families — look to move between the end and start of a new school year. The peak month for real estate rehab purchases has always been January. The seasonal patterns in real estate markets, like many other things, were disrupted by the COVID-19 pandemic. Record-breaking sales volumes reported immediately after the pandemic made it clear that homes are more valuable for sheltering in place. Even in months that traditionally see fewer transactions, like December, home sales broke records after the lockdowns were lifted.
May numbers confirm that seasonality trends are reverting back to their formerly consistent patterns as activity moderates. We expect the purchase activity by investors intending to rehab and flip to continue declining or flatlining for the remainder of the summer and start picking back up in October.
Flipper Purchases by Month
These are purchases by known rehab investors who have resold within 12 months at a profit. Individual data points are volatile, so look for trends over the course of months.
Percentage of Flipper Purchases of Total Home Sales
Increasing and decreasing percentage of rehab purchases by investors reflects market exuberance or fatigue — respectively — and is a leading indicator of price expectations.
Flipper Purchases by Price Range
Percentage of purchases within price segments reflects both market price movements and owner occupant preferences.
Flipped Properties by Property Type
Property mix pool of purchases is impacted by what comes on the market, but also potential for a property to be used or rezoned as a multi-family home or ADU. Legislative emphasis on increasing housing supply and zoning changes will be factors in how this develops.
Flipped Properties by Square Footage
Lifestyle, generational preferences, and major events like the pandemic can impact what buyers and sellers want, and boots-on-the-ground rehab investors are the first to notice the trends.
Sundae uses public sales data to analyze transactions and defines flippers as investors who bought and resold a property within 1 year and who do not form an LLC. Due to the increased number of activity and in-person office closures, clerk-recorders offices experienced delays, therefore; some data is experiencing a lag.
Discover nationwide properties you won’t find elsewhere
Find, win, and close on exclusive and vetted investment properties.


